
Various emerging technologies in precision agriculture improve crop management, yields and agricultural sustainability. Together, several of these technologies (including GPS systems, drones, image analysis and advanced spraying systems) can be used to improve traditional weed control in corn fields and, at the same time, provide financial savings for corn producers, as well as decrease the amount of herbicide applied to croplands.
Corn was chosen for our research because it is a widely grown crop in North Dakota and because of the 30- inch space between the rows used for corn production at NDSU’s Carrington Research Extension Center (located 142 miles northwest of Fargo). The wider spacing facilitates mapping the weeds growing between rows since they are easier to see in drone’s images, which is a key point of this research project.
Currently, the most common approach for weed control in corn involves two herbicide applications per growing season. The first is usually done pre-planting or pre-emergence (before the corn seedlings grow out of the ground) in order to rid the field of weeds for crop establishment and early development.
The second application is done when the corn plants have four to six leaves to take care of weeds that were missed in the first application. Both applications are usually done in blanket fashion, meaning the whole field is sprayed regardless of weed presence or distribution. However, weeds usually grow in patches across a field, so it makes sense to spray only those areas, especially during the second herbicide application.
Site-Specific Weed Control
Site-specific weed control (SSWC) is known as a practice to control weeds according to their spatial distribution across a field. Commercial solutions, such as WeedSeeker by Trimblei and See & Spray Select™ by John Deere,ii enable farmers to implement SSWC on fallow ground or later in the season when the machinery’s sensors can differentiate green weeds from the brown leaves of mature crops.
Recently John Deere upgraded their technology with See & Spray™ Ultimate,iii which uses 36 cameras mounted across the sprayer boom (120 ft), computer vision and machine learning to distinguish weeds from crops and to activate the nozzles to spray only the weeds. All of that is accomplished in only a fraction of a second.
The downside of this impressive technological advance is the hefty cost. See & Spray™ Ultimate comes only as a factory installed option, meaning a new sprayer must be purchased. The current cost for a John Deere sprayer (410R R Self-Propelled Sprayer, the smaller sprayer with that latest technology) with the Spray & Select™ technology is about $786,000. Most likely the upgrade to See & Spray Ultimate,™ the price of which hasn’t been made public yet, will increase the cost even more, especially when considering larger sprayers (612R model, for example).
NDSU Solution
To overcome the challenge of differentiating weeds from crops during the growing season, my graduate students and I have been collaborating with two researchers at the NDSU Carrington Research Extension Center (CREC)—Michael Ostlie, PhD, (formerly a research agronomist and now CREC’s director) and David Kramar, PhD, (a precision agriculture specialist at CREC)—to develop and implement a SSWC solution when corn plants have four to six leaves. The solution uses drones, specialized software and state-of-the-art sprayer technology.
Hi-Res Imagery
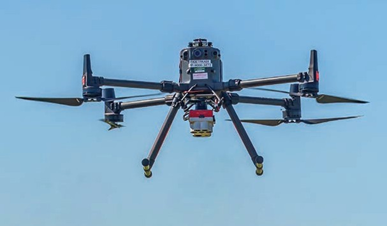
The first step involves collecting high-resolution imagery of the corn field with a drone. In the past few years, we used a DJI Matrice 600 Pro drone equipped with a 42-megapixel camera, which allowed us to collect high-resolution imagery when flying at an altitude of 350 ft. The images enabled us to separate ground from plants and weed from crops, since we could identify weeds as small as a quarter-inch square. However, we had to slow the drone down to allow enough time for the camera to capture the images, which resulted in three flights that took about an hour to cover 50 acres. That led us to look for better hardware solution to improve data collection.
During the 2022 growing season, we upgraded to a DJI Matrice 300 drone to fly two cameras, a DJI Zenmuse P1 and a MicaSense AltumPT. Then, with both cameras, we were able to fly the same land area in one flight in about 30 minutes. As well, these cameras made it easier to process the data after the flights, further increasing efficiencies.
Mapping
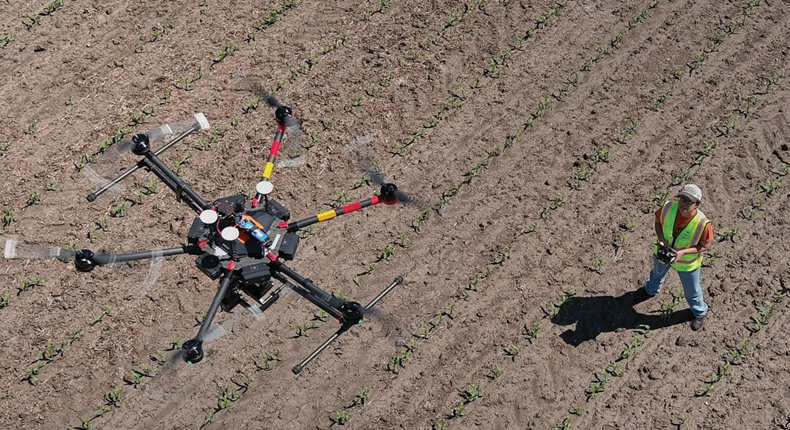
In addition to high-resolution photos, we need to ensure that the location of weeds on the images matches as close as possible to their location on the ground. To accomplish this, the drone is equipped with a GPS RTK receiver system with sub-inch accuracy, which matches the accuracy of the sprayers with the same GPS technology.
Once we have the field images from the drone, we run them through Pix4Dmapper software to create—that is, “stitch”—one large orthomosaic image or map of the entire field. Pix4Dmapper uses the GPS data, encoded in each image, to correct for distortions caused by the inherent characteristics of any camera’s sensor and due to topographic changes on the landscape. The software then seamlessly stitches all the images into one large image or, more technically correct, orthoimage or orthomosaic (Figure 1).
Every pixel on the orthomosaic image is mapped to its real location on the earth’s surface using precise latitudinal and longitudinal values. This is a key aspect for us. Just as the GPS app on a cellphone enables drivers to reach a specific location, the orthomosaic imagery enables us to track the position of the weeds in relation to each nozzle of the sprayer, so we can turn nozzles off at “locations” with no weeds.
Weed-Only Orthomosaic
Now that we have the orthomosaic imagery of the field, it is time to map the weeds. First, we identify the rows of corn plants across the field (yellow lines on Figure 3). Then, in our approach, we determine that any plant growing between the yellow rows is a weed (green polygons in Figure 3), so it needs to be sprayed. To create a weed-only orthomosaic, we remove all corn rows and classify the remaining vegetation as weeds.
Weed Map
Next, we need to convert weed location into instructions that the sprayer can understand and so know where to shut off spray nozzles as it moves across the field. We do that by placing a grid cell, usually 10 x 10 feet, over the field’s weed-only orthoimage as described in Figure 3. A cell that contains at least one weed is sprayed, while cells free of weed are not sprayed. This approach enables us to take care of small weeds that might not have been detected in the cell and also weeds growing within the corn rows in each cell, since the 10-ft-wide cell covers up to 4 corn rows.
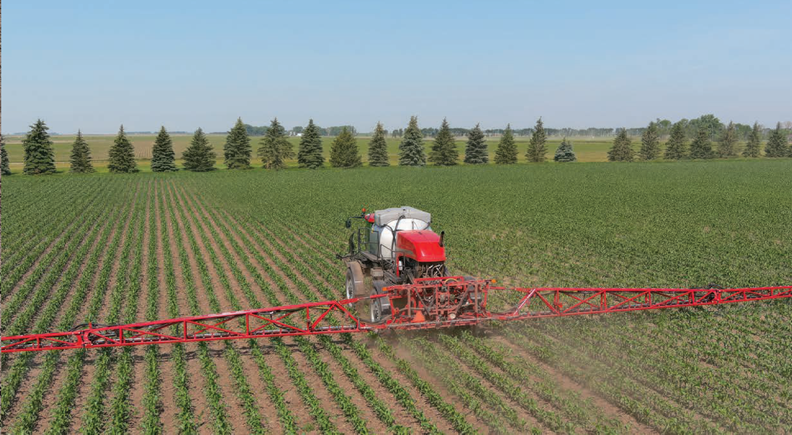
After determining which cells should be sprayed (15 gallons/acre of solution, in our case) or not (0 gallons/ acre of solution), we use AgLeader SMS software to translate the “weed map + grid cell” information into an application rate map, which the computer in the sprayer’s cab can read and act upon. This process is known as writing a prescription map, or an Rx map, to the sprayer. Just as one would follow a medicine prescription, the sprayer will follow the instructions provided in the Rx map and apply herbicide at a pre-determined rate (15 or 0 gallons/acre, in our case). Based on that Rx map, the sprayer’s nozzles turn on and off automatically as the machine is driven across the field.
In the summer of 2022, we implemented this entire protocol, with one small adjustment. Instead of using the original cell size of 10 x 10 ft, we used a 5ft wide x 10 ft long grid cell size to improve savings on sprayed acres. By doing so, we did not have to spray 50 percent of the area where we were implementing the SSWC (Figure 4). To put that into perspective, for each quarter of section of corn (160 acres), a farmer would not need to spray 80 acres. Giving the current prices of chemicals, that could lead to significant savings for corn growers in the state.
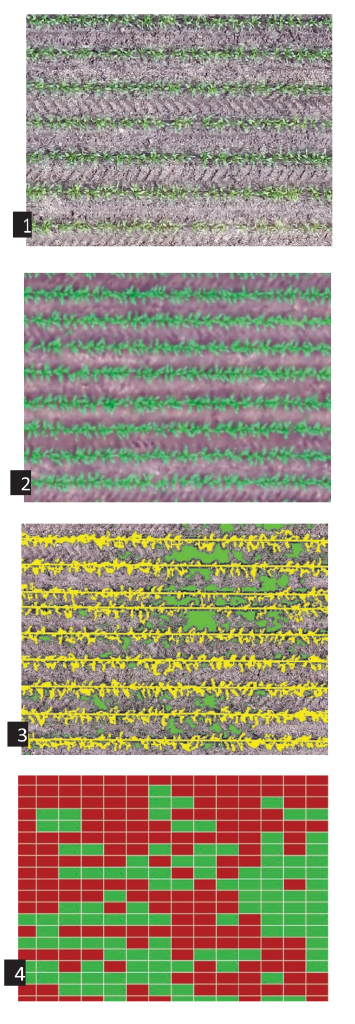
Figure 1
A sample of an RGB (red, green, blue) orthomosaic that is composed of high-resolution images taken by the Zenmuse P1 camera, which produces photos similar to what a consumer camera or cellphone typically takes. All images in this article were taken from our drone flying at 200 ft above ground on June 28, 2022.
Figure 2
A sample of an RGB orthomosaic taken by the AltumPT camera, which is a multispectral device that captures light beyond the human vision spectrum. The filters on that sensor allow very specific colors—more scientifically, wavelengths—to pass through (which distinguishes this image from the previous one, even though they are both RGB orthomosaics). In addition to RGB colors, the AltumPT sensor can “see” light on the red-edge and low-infrared part of the electromagnetic spectrum, regions of light that are highly reflected by plants. We take advantage of this in the first step of our research analysis. With the AltumPT imagery, we produce an NDVI (normalized difference vegetation index) map that “quantifies vegetation by measuring the difference between near-infrared (which vegetation strongly reflects) and red light (which vegetation absorbs).”iv This highlights the green vegetation, creating a greater contrast with the soil background.
Figure 3
Section of the field showing the corn rows (yellow lines) and weeds growing between the corn rows (green polygons). A weed-only map is obtained by removing the corn plants from the image.
Figure 4
Visualization of the Rx map in the field for one experimental plot. For this research study, we divided the 50-acre field into plots (400 ft long by 136.6 ft wide). In this plot, the red cells indicate areas to be sprayed (15 gallons/acre), while the green ones indicate areas not to be sprayed. The overall average for the SSWC treatment in this study showed that 50 percent of the area did not need to be sprayed.
Challenges
Although this approach seems to be very promising, there were several challenges. First is scalability. When using a drone, the number of acres that can be covered in a day is limited by the drone’s battery life, which dictates flight altitude and flight speed. It took about 30 minutes—the flight-time limit of the drone’s battery pack (two batteries)—to cover the 50-acre field with each camera. To cover a section of land (640 acres) would take about seven hours of flight time, which would require 12 more battery sets. Fewer battery sets would be needed— maybe six sets—if the batteries could be recharged in the field. Without the capacity to recharge, which is usually not available, it is difficult, and cost prohibitive for some farmers, to cover large acreage with the technology used on this research project. The total investment was $49,994: $13,199 for our drone, $19,995 for the AltumPT camera and $16,800 for 12 extra sets of batteries.
The second challenge is the cost of the hardware in the sprayer (including the cab computer), individual nozzle controls and the RTK GPS receiver. These would increase the base cost (around $550,000) of a sprayer used in this research (Case IH Patriot 4440) by about $83,000.
A third challenge is developing and automating a workflow that would enable a quick turnaround of the collected data—that is, in less than 24 hours. Working with 50 acres, we collected 100 gigabytes of data with the cameras. We were then able to produce an Rx map within 24 hours. The challenge to make this process viable for farmers will be to process about one terabyte of data from 640 acres and create an Rx map within 24 hours. Clearly, this process would have to become almost 13 times more efficient, which automation could achieve. Automation would also make the process many times more affordable since it currently takes about five man-hours to produce an Rx map for 50 acres.
Near Future
We are looking for ways to improve our workflow by automating parts of our workflow from stitching the orthomosaic image to processing and generating an Rx map. To accomplish this, we will continue to collaborate with David Kramar who is now the Research Director at the International Water Institute. His expertise in spatial analysis, image analysis and machine learning applications will be key to enhancing our workflow.
We are also collaborating with Erik Hanson, PhD, an Assistant Professor in NDSU’s Department of Agribusiness and Applied Economics. Prof. Hanson will carry out an economic assessment of our SSWC approach, since there are many variables to be considered when trying to make economic sense of this approach. Some of the questions that he will be addressing are:
- What is the return on investment for farmers implementing our SSWC approach?
- What are the savings associated with reduced use of herbicide and water (less frequent sprayer refills)?
- What is the minimum no-spray percentage in a field (20 percent? 30 percent? 40 percent? Or?) needed for a farmer to realize economic benefits when using our SSWC approach?
Post-Harvest Weeds
We realize that an important factor that might affect a farmer’s willingness to adopt our SSWC approach is how the post-harvest amount of weeds in the cells, which were sprayed in the spring, compares to the amount of post-harvest weeds in the cells that weren’t sprayed. If the sprayed cells had about the same amount of post-harvest weeds as the cells that weren’t sprayed, then the savings in herbicide use and financial costs when using our SSWC approach might increase the likelihood of adoption.
To determine this, after the harvest we flew our drone over the same field, collected images with the AltumPT camera and generated a post-harvest orthomosaic map. Our preliminary analysis shows that there were very few weeds across the entire field. Since there was no difference between the sprayed and non-sprayed cells post-harvest, we can conclude that our SSWC approach provides similar weed control as the blanket application, while decreasing the sprayed acreage by half.
References
i https://agriculture.trimble.com/product/weedseeker-2-spot-spray-system/
ii https://www.deere.com/en/sprayers/see-spray-select/
iii https://www.deere.com/en/sprayers/see-spray-ultimate/
iv https://gisgeography.com/ndvi-normalized-difference-vegetation-index/
PAULO FLORES, PHD Assistant Professor, Dept of Ag & Biosystems Engineering, NDSU
Paulo Flores, PhD, is an Assistant Professor at the Agricultural and Biosystems Engineering Department at NDSU. He earned his BS in Agronomy at the Federal University of Santa Maria and his master’s and doctorate degrees in Soil Sciences at the Federal University of Rio Grande do Sul, both universities in Brazil. At NDSU, Prof. Flores developed three new courses in precision agriculture and codeveloped another course on the use of drones for precision ag. He researches the use of drones and sensors for site-specific weed control, and he also investigates implementing high-throughput phenotyping approaches in several NDSU plant-breeding programs. Prof. Flores has authored and coauthored several research papers on the use of drones, sensors and imagery analysis for agricultural purposes, which were published in specialized journals such as Remote Sensing and Frontiers in Plant Science.
